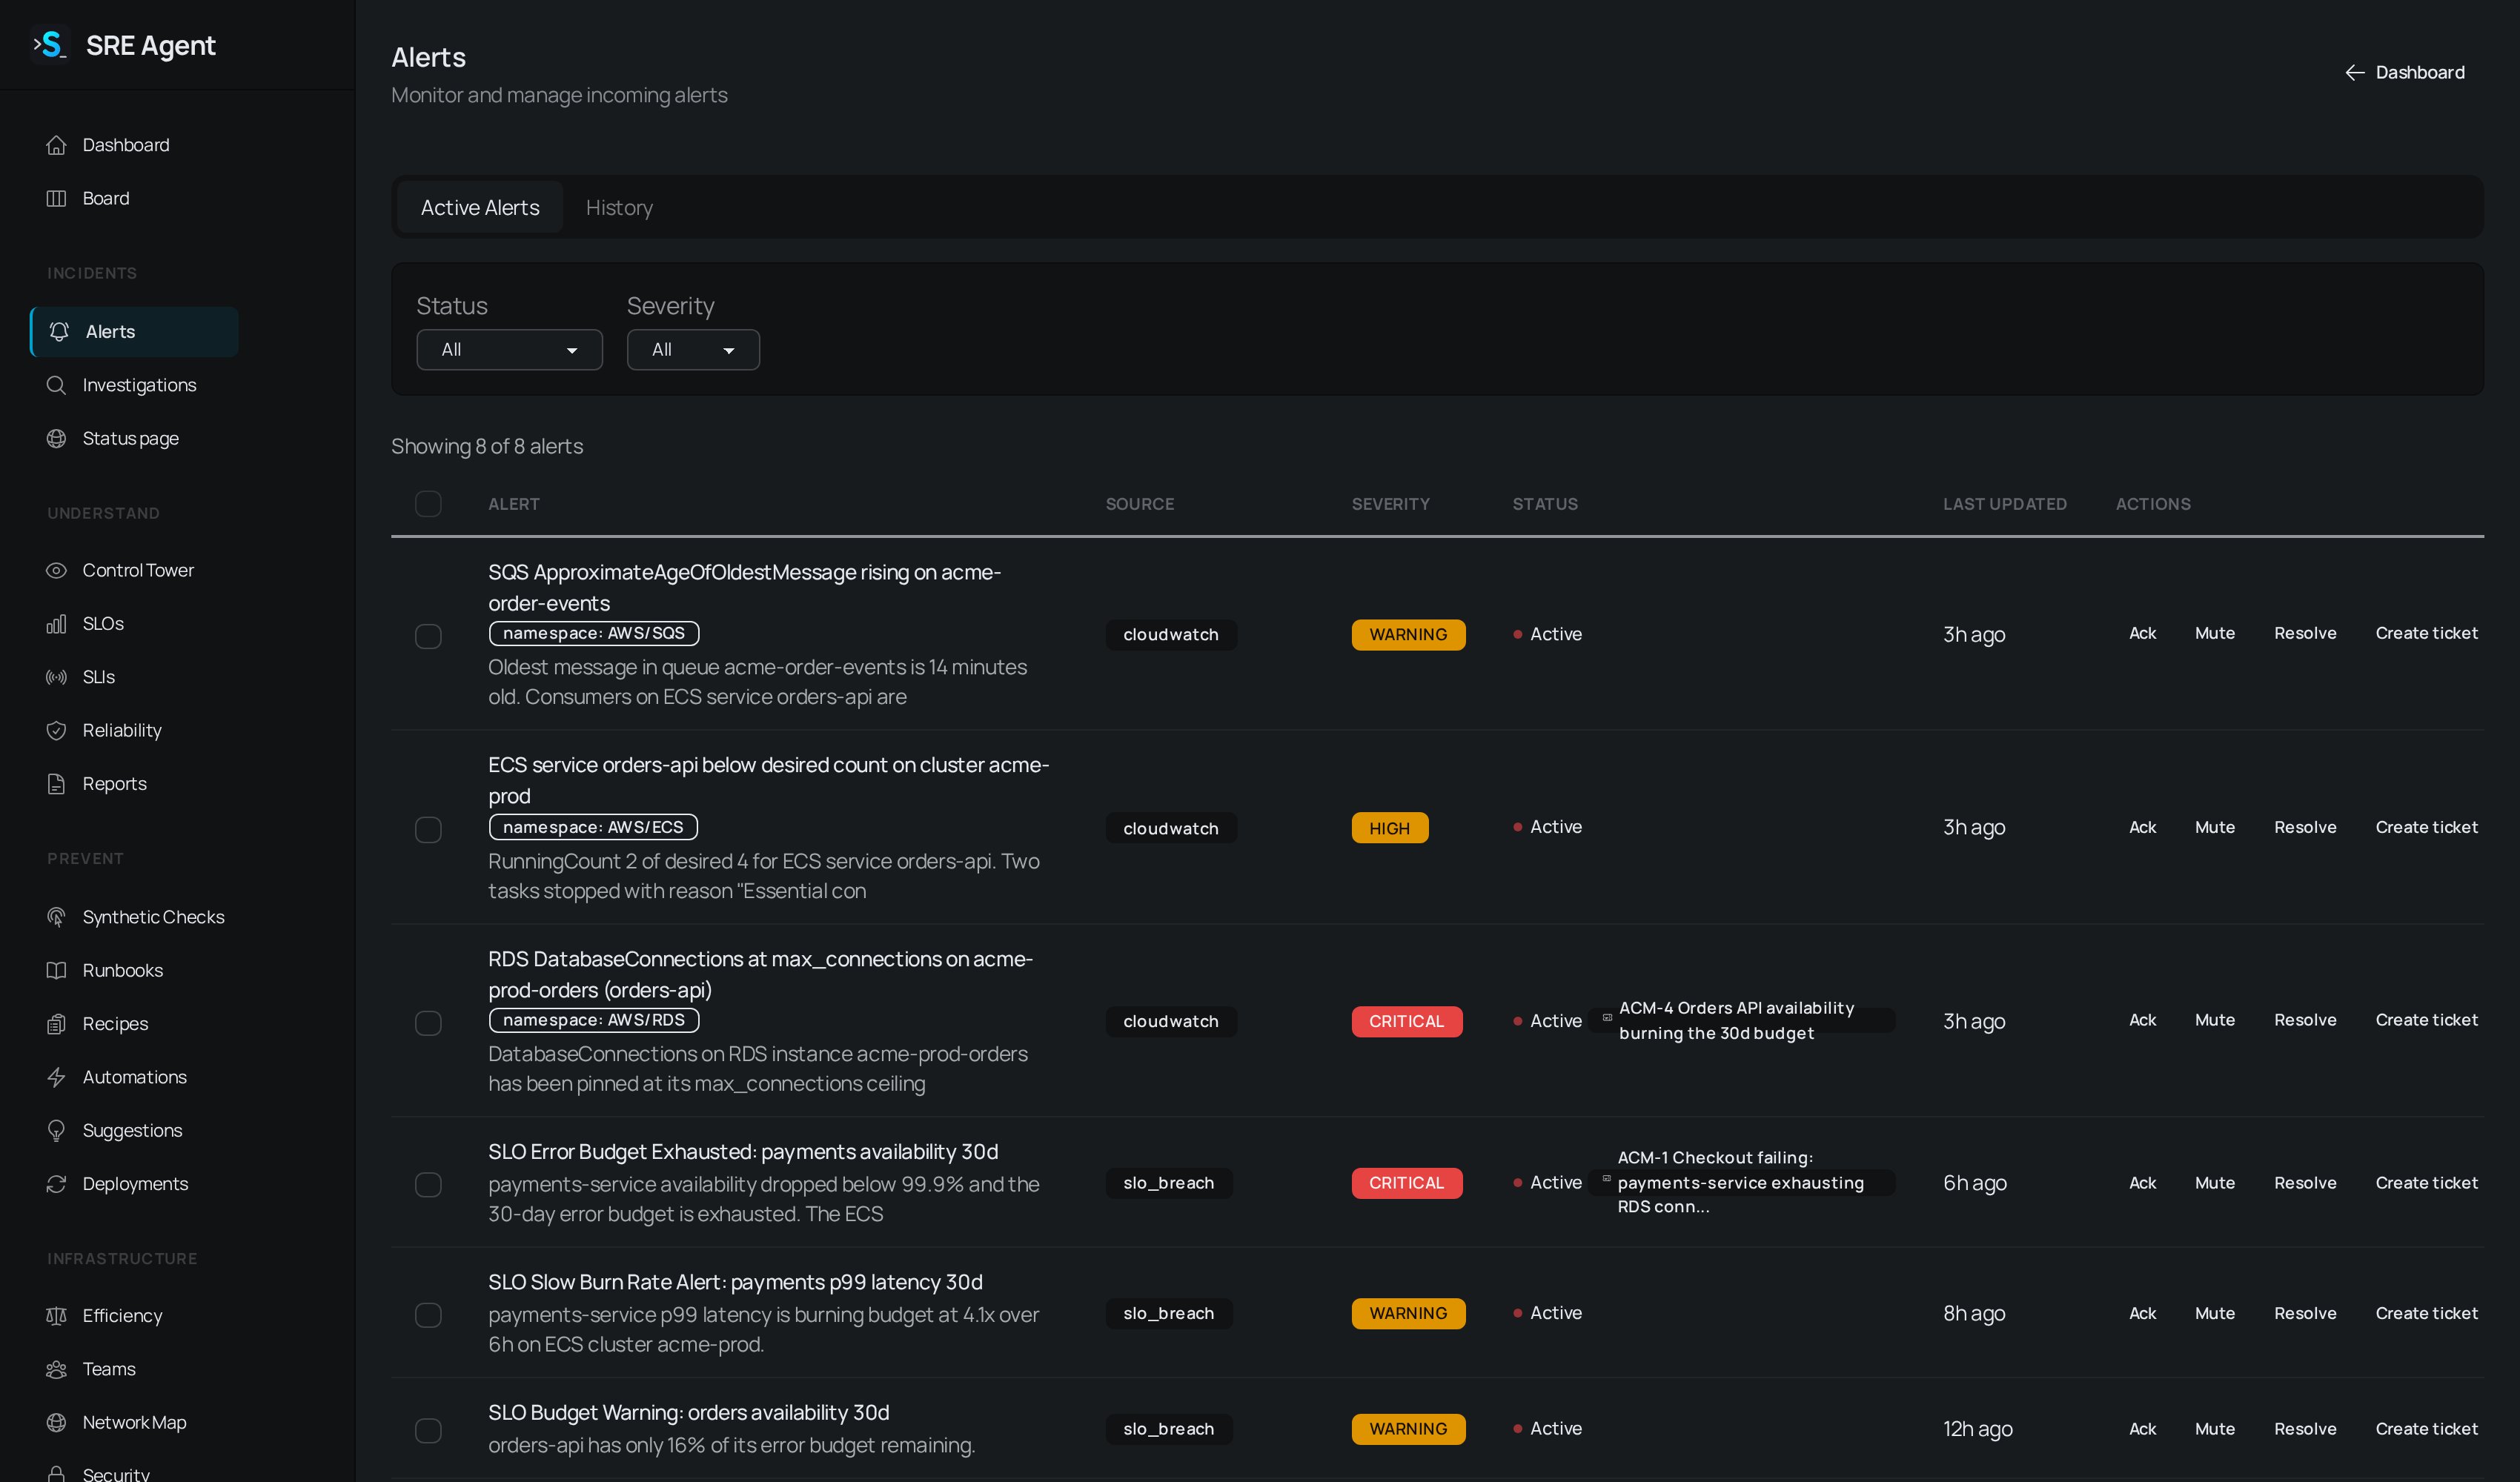
The Alerts page listing active alerts with their source, severity, status and the Ack, Mute, Resolve and Create ticket actions.
Where alerts come from
Each organization has its own webhook token. Point your tools at the URLs shown under Integrations, Webhooks (each one embeds the token, so treat it like a password).
You can also create an alert yourself with
/sre-alert <title> in Slack, or post one through the public API. SLO breaches, synthetic checks and certificate monitors raise alerts of their own. Every alert gets the same treatment, whatever its source: it is deduplicated, checked against your mutes, recorded on its own timeline and offered to your outbound alerting rules.
Triage an alert
1
Open the alert list
Go to Alerts. Active Alerts shows what needs attention and History shows everything
else. Each row shows the title, source, severity, status and when it last changed.
2
Filter the list
Use the Status filter (Active, Acknowledged, Muted, Resolved) and the Severity filter
(Critical, High, Warning, Medium, Low). Clear filters resets both.
3
Open the alert
Click a row. The alert opens with its resource tags, description and labels, any related
deployments, and an Activity timeline of every fire, acknowledgement and resolve.
4
Act on it
Use the row buttons or the same buttons inside the alert, listed in the table below.
To act on many alerts at once, tick the boxes on the left of the rows and use the Acknowledge, Resolve or Mute buttons that appear above the table. Starting an investigation and paging stay per alert on purpose.
Members and admins can acknowledge, mute and resolve. Viewers can read.
When several alerts arrive together, an Alert storm banner shows how many were grouped and
links to the group’s investigation when one exists.
Dedup, resolve and re-fire
An alert is identified by its fingerprint. If your tool sends the same alert again while it is still firing, SRE Agent updates the existing alert instead of creating another. A repeat of a resolved alert reopens it. An alert resolves when you click Resolve, when your tool sends a recovery, or when the condition clears on its own. The resolve time is recorded in the timeline, and the Slack thread gets an “Alert Resolved” reply.Quiet re-fire
An alarm that clears and fires again every few minutes would otherwise page you every cycle. SRE Agent reopens it quietly instead. The alert reopens and its timeline records the re-fire, but you get one reply in the existing Slack thread (edited in place on later re-fires), no new page, and no automatic investigation. An organization admin sets the window under Settings, Preferences, Re-fire cooldown (minutes). The default is 30 minutes and the maximum is 1440. A value of 0 pages on every re-fire. Nothing is dropped either way, and the timeline shows every fire and resolve.The flapping badge
A rule that fires many times in a week and usually clears itself within minutes is marked flapping. The alert list shows a flapping badge you can hover for the numbers (how often it fired, how long it takes to clear, what to tune). The alert itself and its Slack message carry the same note. A flapping alert is never muted or hidden, and it still counts. SRE Agent only stops starting an automatic investigation for each occurrence. You can still start one by hand, and a rule that fires at a higher severity leaves the flapping state on its own.What you see in Slack
A new alert opens a message in the channel set for its service, or for its severity when the service has no route. The message has View Alert, Acknowledge, Improve this alert and Related alerts buttons, plus View Investigation once one exists. See Slack for channel setup and commands.Related
- Run and read an investigation: let the agent find the cause.
- Set up on-call: decide who gets paged.
- Track work on the ops board: track the follow-up work as a card.
- Webhook endpoints: every inbound alert URL and its response codes.