> ## Documentation Index
> Fetch the complete documentation index at: https://docs.sreagent.app/llms.txt
> Use this file to discover all available pages before exploring further.
# Run and read an investigation
> Start an AI investigation on an alert, read its root cause and evidence, and follow up from the result.
export const Plan = ({tier}) => {tier} plan;
An investigation is the AI agent working an alert for you. It queries the data sources you connected, records findings with evidence, and ends with a summary and a root cause.
Your plan sets a monthly allowance of investigations. Free includes 10 a month, and the paid plans include more.
 ## Start an investigation
Go to **Alerts** and click the alert. Scroll to the **Investigation** section. If earlier runs
exist, a **View existing investigation(s)** link lists them.
Choose the **AI Provider** and, when the provider offers a choice, the **Model**. If a warning
says no provider is configured, follow its **Configure a provider** link first. A second warning
appears when no data source is connected, because the agent then has no metrics or logs to read
and its results are shallow.
Tick **Deep investigation** to run parallel metrics, logs, changes and traces scouts. It finds
more and uses more tokens.
Click **Start Investigation**. You land on the investigation page and watch it run.
Many alerts start an investigation on their own. You can always start one by hand, including for a flapping alert, and you can also run one from Slack with `/sre-investigate ` or by reacting to the alert message with the :rotating\_light: emoji.
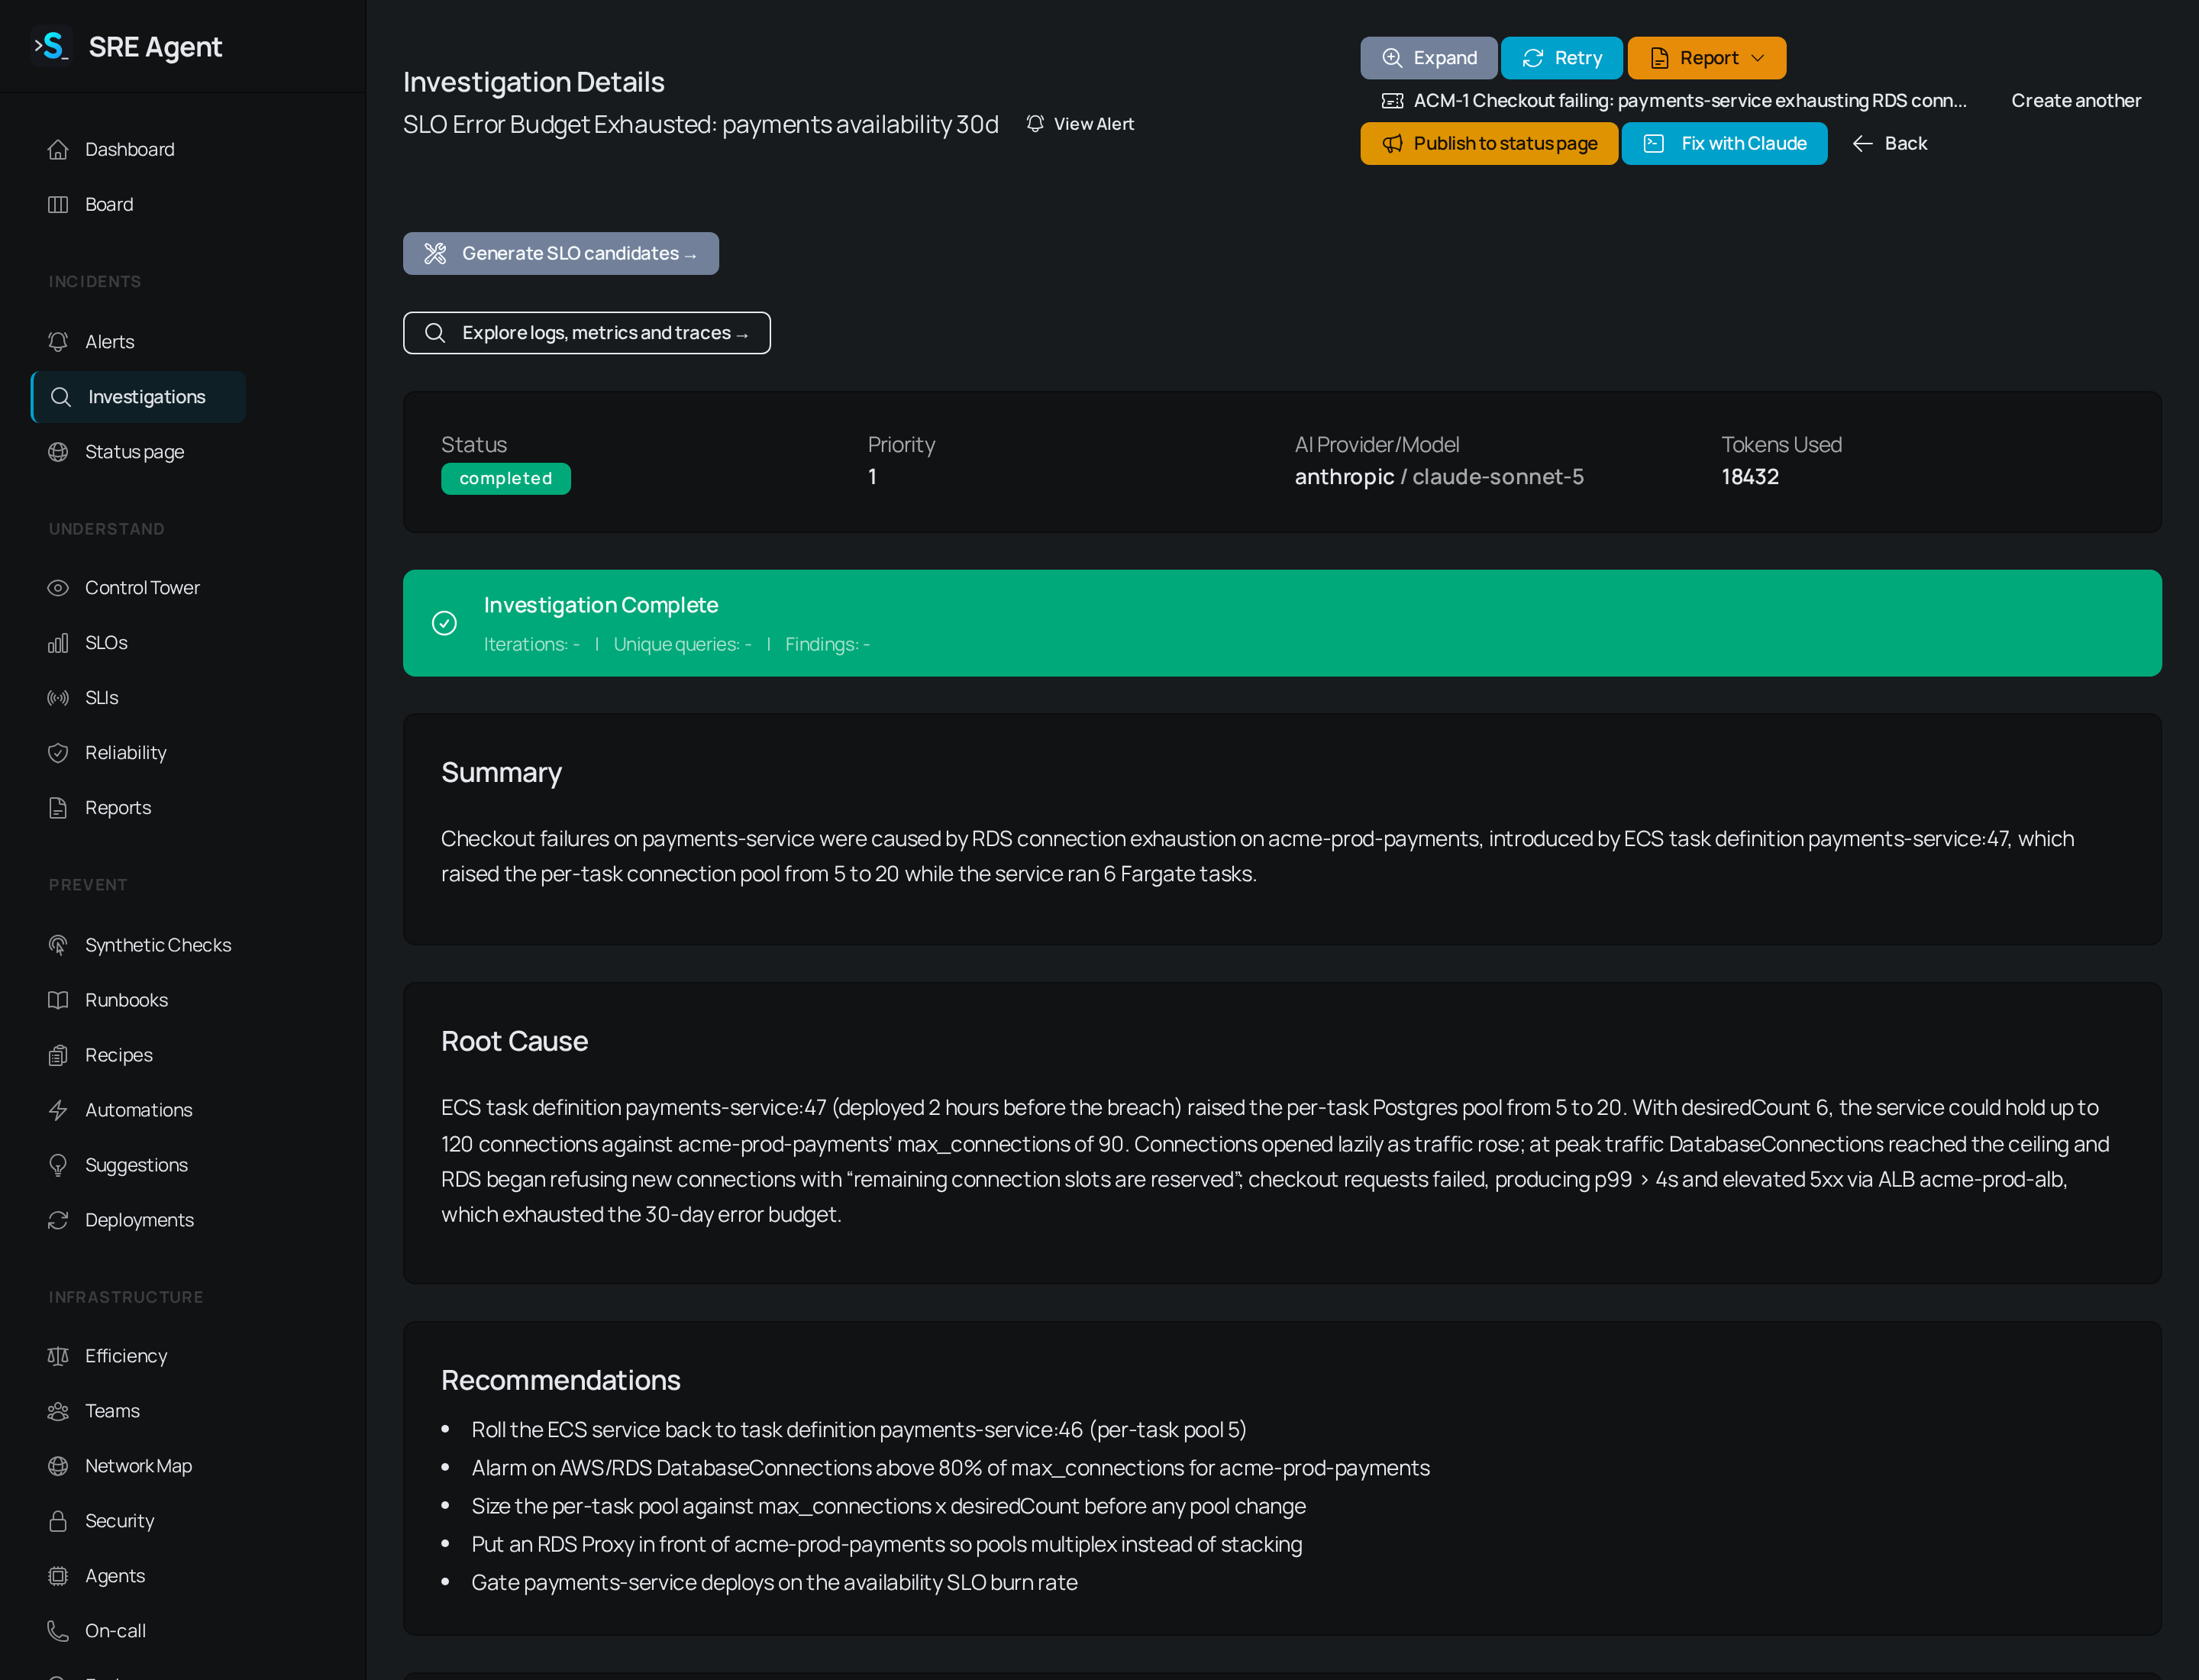
## Read the result
While the run is active the page shows the current step (out of a maximum of 30), how many unique queries ran and how many findings are recorded. A **Stop** button ends the run early. When it finishes, read the page from the top:
| Section | What it tells you |
| - | - |
| **Summary** | What happened, in a few sentences. |
| **Root Cause** | The agent's conclusion about why. |
| **Recommendations** | What to do next. |
| **Findings** | Each finding has a type, a severity, a confidence percentage, a description and suggested actions. |
| **Gathered evidence** | The queries behind the findings, with the provider, outcome, time window and source. |
| **Investigation Timeline** | Every tool call the agent made, in order. |
| **Similar Past Investigations** | Earlier runs that look like this one. |
Each finding lists the evidence it cites. **Open in Explore** on an evidence row re-runs that query live in the Explorer, which needs the Business plan (see [Explore logs, metrics and traces](/guides/respond/explore)). The live result can differ from the excerpt stored with the finding, because your provider's data changes.
The agent reads metrics, logs, traces, alert history, similar alerts, service dependencies and matching runbooks from what you connected. It works through your metrics first, then utilization and recent changes, then correlations and history, and ends by testing hypotheses about the cause.
A status of **partial** means the AI provider failed part way. The results shown are real but
incomplete. Check your provider settings and use **Retry**.
## Follow up
The buttons at the top of a finished investigation:
* **Expand** starts a follow-up run that begins from what this one found.
* **Retry** opens **Retry Investigation**, where you pick a provider and optionally a model, then click **Start Investigation**. It is available after a run fails, finishes, is partial or is cancelled.
* **Report** offers a **Technical Report**, a **Management Report** or a **Customer Report**.
* **Publish to status page** opens a customer-facing incident pre-filled from the investigation, if you manage your status page.
* **Fix with Claude** hands a frozen fix brief to your own local agent session.
* **View Alert** and **Explore logs, metrics and traces** take you back to the alert or into the Explorer for the same service and window.
## Create a ticket from an investigation
The button sits in the header of a finished investigation. If a ticket was already filed for the
alert, the page shows it and a **Create another** button.
The title and description are drafted from the alert and its last completed investigations. An
**AI-drafted** badge appears when the refinement arrives, and anything you edit is kept. Pick a
**Repository** if the card is about a specific one.
The card always opens on your ops board. If a Jira, Zoho Sprints or GitHub integration is
connected, tick **Also file it in** to mirror it there. To also open a fix pull request, tick
**Also open a fix pull request for this ticket**.
Click **Create ticket**. The confirmation names the card and gives a **View ticket** link.
See [Ops board](/guides/respond/ops-board) for what you can do with the card.
## From Slack
When an investigation completes, the result posts in the alert's thread with **View Full Investigation**, **Acknowledge Alert**, **Resolve Alert** and **Create Ticket** buttons.
## Related
* [Triage alerts](/guides/respond/alerts): where investigations start.
* [Request a fix as a pull request](/guides/fix/fix-requests): turn a root cause into a pull request.
* [Fix with Claude](/guides/fix/fix-with-claude): hand the problem to your own machine.
* [Connect your data](/guides/get-started/connect-your-data): the data an investigation can query.
This documentation is built and hosted on [Mintlify](https://mintlify.com), a developer documentation platform.
## Start an investigation
Go to **Alerts** and click the alert. Scroll to the **Investigation** section. If earlier runs
exist, a **View existing investigation(s)** link lists them.
Choose the **AI Provider** and, when the provider offers a choice, the **Model**. If a warning
says no provider is configured, follow its **Configure a provider** link first. A second warning
appears when no data source is connected, because the agent then has no metrics or logs to read
and its results are shallow.
Tick **Deep investigation** to run parallel metrics, logs, changes and traces scouts. It finds
more and uses more tokens.
Click **Start Investigation**. You land on the investigation page and watch it run.
Many alerts start an investigation on their own. You can always start one by hand, including for a flapping alert, and you can also run one from Slack with `/sre-investigate ` or by reacting to the alert message with the :rotating\_light: emoji.
## Read the result
While the run is active the page shows the current step (out of a maximum of 30), how many unique queries ran and how many findings are recorded. A **Stop** button ends the run early. When it finishes, read the page from the top:
| Section | What it tells you |
| - | - |
| **Summary** | What happened, in a few sentences. |
| **Root Cause** | The agent's conclusion about why. |
| **Recommendations** | What to do next. |
| **Findings** | Each finding has a type, a severity, a confidence percentage, a description and suggested actions. |
| **Gathered evidence** | The queries behind the findings, with the provider, outcome, time window and source. |
| **Investigation Timeline** | Every tool call the agent made, in order. |
| **Similar Past Investigations** | Earlier runs that look like this one. |
Each finding lists the evidence it cites. **Open in Explore** on an evidence row re-runs that query live in the Explorer, which needs the Business plan (see [Explore logs, metrics and traces](/guides/respond/explore)). The live result can differ from the excerpt stored with the finding, because your provider's data changes.
The agent reads metrics, logs, traces, alert history, similar alerts, service dependencies and matching runbooks from what you connected. It works through your metrics first, then utilization and recent changes, then correlations and history, and ends by testing hypotheses about the cause.
A status of **partial** means the AI provider failed part way. The results shown are real but
incomplete. Check your provider settings and use **Retry**.
## Follow up
The buttons at the top of a finished investigation:
* **Expand** starts a follow-up run that begins from what this one found.
* **Retry** opens **Retry Investigation**, where you pick a provider and optionally a model, then click **Start Investigation**. It is available after a run fails, finishes, is partial or is cancelled.
* **Report** offers a **Technical Report**, a **Management Report** or a **Customer Report**.
* **Publish to status page** opens a customer-facing incident pre-filled from the investigation, if you manage your status page.
* **Fix with Claude** hands a frozen fix brief to your own local agent session.
* **View Alert** and **Explore logs, metrics and traces** take you back to the alert or into the Explorer for the same service and window.
## Create a ticket from an investigation
The button sits in the header of a finished investigation. If a ticket was already filed for the
alert, the page shows it and a **Create another** button.
The title and description are drafted from the alert and its last completed investigations. An
**AI-drafted** badge appears when the refinement arrives, and anything you edit is kept. Pick a
**Repository** if the card is about a specific one.
The card always opens on your ops board. If a Jira, Zoho Sprints or GitHub integration is
connected, tick **Also file it in** to mirror it there. To also open a fix pull request, tick
**Also open a fix pull request for this ticket**.
Click **Create ticket**. The confirmation names the card and gives a **View ticket** link.
See [Ops board](/guides/respond/ops-board) for what you can do with the card.
## From Slack
When an investigation completes, the result posts in the alert's thread with **View Full Investigation**, **Acknowledge Alert**, **Resolve Alert** and **Create Ticket** buttons.
## Related
* [Triage alerts](/guides/respond/alerts): where investigations start.
* [Request a fix as a pull request](/guides/fix/fix-requests): turn a root cause into a pull request.
* [Fix with Claude](/guides/fix/fix-with-claude): hand the problem to your own machine.
* [Connect your data](/guides/get-started/connect-your-data): the data an investigation can query.
This documentation is built and hosted on [Mintlify](https://mintlify.com), a developer documentation platform.