> ## Documentation Index
> Fetch the complete documentation index at: https://docs.sreagent.app/llms.txt
> Use this file to discover all available pages before exploring further.
# Set up SLOs
> Create service level objectives from your own metrics, read compliance and error budget, and know what degraded and suspended mean.
export const Plan = ({tier}) => {tier} plan;
An SLO turns "this service should be reliable" into a target you can measure and alert on. You pick an indicator (an SLI) such as availability or p99 latency, set a target such as 99.9% over 30 days, and SRE Agent tracks the remaining error budget.
 ## Create SLOs with the wizard
The wizard needs the Pro plan. It finds your workloads, proposes indicators, and checks each one against 30 days of your real data before you commit to a target.
Go to **SLOs** and click **New SLO** (it opens the wizard), or open **Manage SLIs** and click
**SLO Wizard**. From an alert or an investigation that carries a service label, click **Generate
SLO candidates →** to skip straight to the probe step.
Choose where the metrics live. The wizard lists Prometheus, CloudWatch Metrics and Loki sources.
Click the one you want. If none appear, add one under **Settings** on the **Data Sources** tab.
The table shows each workload's name, **Alerts (7d)**, **Existing SLIs** and **Series**. The
noisiest workloads come first. Click **Generate SLO candidates →** on the one you want.
The wizard proposes up to four indicators using the RED method: rate, errors and duration, plus
saturation when CPU, memory or connection metrics exist. Dimensions with no matching metrics are
left out. Results stream in, so you can act on one card while others are still probing.
Each card shows the query, **Observed 30d** compliance and a **Target**. Click **Create SLI +
SLO** on the cards you want. The card changes to **Created.** with a **View SLI →** link.
The recommended target sits about 0.2 percentage points below what the service actually achieved, never lower than 90%, so it is a target you can meet today and still tighten later. When there is no history to measure, the card says **No historical data, using industry default** and uses a typical target for that indicator type instead.
Members and admins can create SLOs. Viewers can read them.
## Create an SLO on a Free plan
SLOs you define yourself are open on every plan, and so are tracking and alerting on them. Open **SLOs > Manage SLIs** and click **Generate AI Suggestions** to get SLI proposals. Click **Approve** and then **Activate** on the one you want, then click **Add SLO** on it. The **Create SLO** form asks for a **Name**, a **Target (%)** and a **Window (days)**, defaulting to 30, plus the burn-rate settings listed in the [SLO reference](/guides/prevent/slo-reference).
## Create an SLO from a synthetic check
If you already probe an endpoint (synthetic checks need Pro), open the check under **Synthetic Checks** and click **Create availability SLO** or **Create latency SLO**. The SLO is built from that check's own results. See [Synthetic checks](/guides/prevent/synthetic-checks).
## Read the dashboard
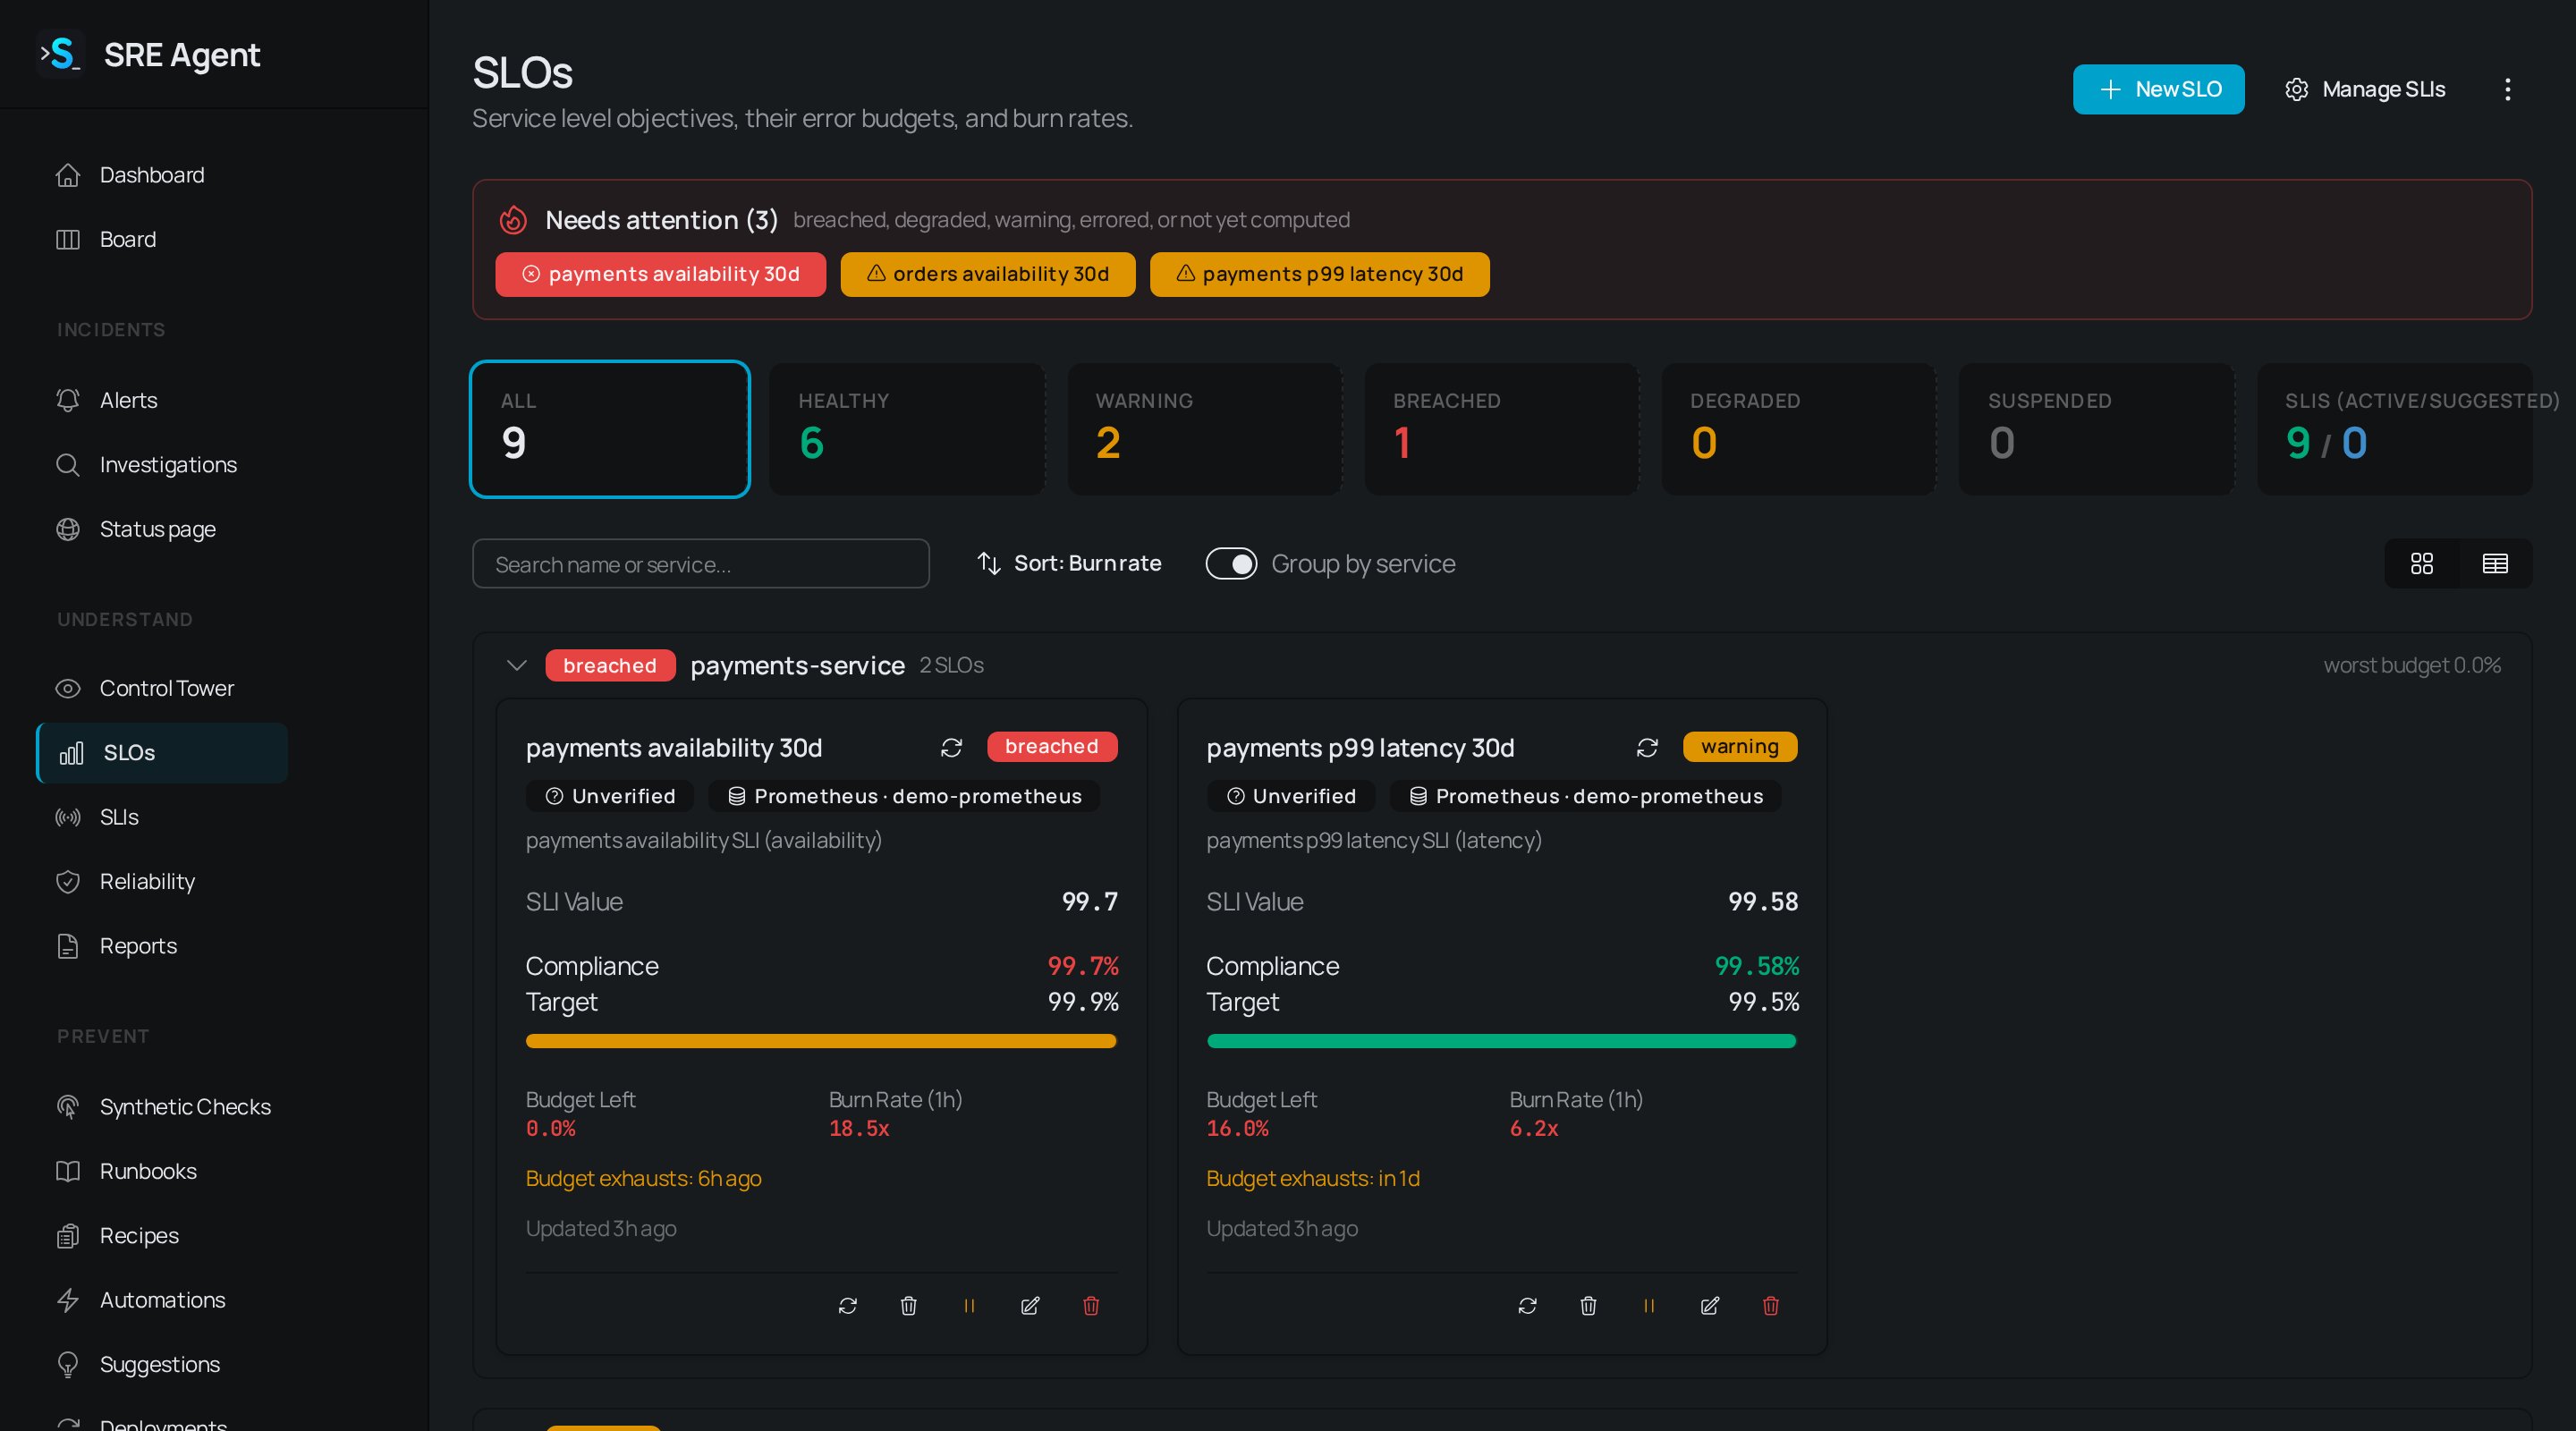
**SLOs** groups objectives by service. The cards at the top filter by **Healthy**, **Warning**, **Breached**, **Degraded** and **Suspended**, and **Needs attention** lists everything that is breached, degraded, warning, failing to compute or not yet computed. Click an SLO to see its compliance, remaining error budget, burn rates and the SLI and data source behind it. **Recompute Now** refreshes it on demand.
## Burn and budget alerts
Open an SLO and use the pencil icon to edit it. **Alert on burn rate**, **Alert on budget warning** and **Alert on tracking failure** control when it alerts, and **Gate deploys on this SLO** controls its deploy gate. Breach alerts arrive like any other alert, so they can page people and trigger runbooks. The thresholds and defaults are in the [SLO reference](/guides/prevent/slo-reference).
## Degraded and no data
An SLO shows **Degraded** when SRE Agent ran the computation and does not trust the answer, for example when the data source is unreachable or returned nothing at all. The reason appears on the card.
An empty answer is treated differently from a zero:
* A service that served no requests counts as 100% compliant. Nothing violated the objective.
* A query that returns no series, rows or datapoints is not reported as 100%. The SLO goes degraded, because a perfect month read off broken monitoring would be misleading.
A degraded SLO recovers by itself: SRE Agent keeps retrying, and the first window with data clears the status and resolves the tracking alert. While it is degraded, it holds the service's deploy gate.
If an SLI shows **Unverified** or no data, open **SLOs > Manage SLIs** and click **Re-probe** once your metrics are flowing. To get good SLIs in the first place, emit one request counter and one latency histogram per service, labelled with the service name, HTTP method, route template and status code.
## Suspend and resume
Click **Suspend** on an SLO (any member can) to pause its computation and alerting, and **Resume** to restart it. The **More** menu on the dashboard has **Maintenance mode (suspend all)** and **Resume all suspended**. Suspending an SLO resolves its own open alerts. A suspended SLO never blocks a deploy, but the gate still reports it so nobody mistakes "not watched" for "healthy".
## Related
* [Connect your data](/guides/get-started/connect-your-data): the data sources an SLI reads.
* [Publish a status page](/guides/prevent/status-page): show SLO health to customers.
* [Triage alerts](/guides/respond/alerts): where SLO breach alerts arrive.
* [Plan matrix](/guides/reference/plan-matrix): which plans include the SLO wizard.
This documentation is built and hosted on [Mintlify](https://mintlify.com), a developer documentation platform.
## Create SLOs with the wizard
The wizard needs the Pro plan. It finds your workloads, proposes indicators, and checks each one against 30 days of your real data before you commit to a target.
Go to **SLOs** and click **New SLO** (it opens the wizard), or open **Manage SLIs** and click
**SLO Wizard**. From an alert or an investigation that carries a service label, click **Generate
SLO candidates →** to skip straight to the probe step.
Choose where the metrics live. The wizard lists Prometheus, CloudWatch Metrics and Loki sources.
Click the one you want. If none appear, add one under **Settings** on the **Data Sources** tab.
The table shows each workload's name, **Alerts (7d)**, **Existing SLIs** and **Series**. The
noisiest workloads come first. Click **Generate SLO candidates →** on the one you want.
The wizard proposes up to four indicators using the RED method: rate, errors and duration, plus
saturation when CPU, memory or connection metrics exist. Dimensions with no matching metrics are
left out. Results stream in, so you can act on one card while others are still probing.
Each card shows the query, **Observed 30d** compliance and a **Target**. Click **Create SLI +
SLO** on the cards you want. The card changes to **Created.** with a **View SLI →** link.
The recommended target sits about 0.2 percentage points below what the service actually achieved, never lower than 90%, so it is a target you can meet today and still tighten later. When there is no history to measure, the card says **No historical data, using industry default** and uses a typical target for that indicator type instead.
Members and admins can create SLOs. Viewers can read them.
## Create an SLO on a Free plan
SLOs you define yourself are open on every plan, and so are tracking and alerting on them. Open **SLOs > Manage SLIs** and click **Generate AI Suggestions** to get SLI proposals. Click **Approve** and then **Activate** on the one you want, then click **Add SLO** on it. The **Create SLO** form asks for a **Name**, a **Target (%)** and a **Window (days)**, defaulting to 30, plus the burn-rate settings listed in the [SLO reference](/guides/prevent/slo-reference).
## Create an SLO from a synthetic check
If you already probe an endpoint (synthetic checks need Pro), open the check under **Synthetic Checks** and click **Create availability SLO** or **Create latency SLO**. The SLO is built from that check's own results. See [Synthetic checks](/guides/prevent/synthetic-checks).
## Read the dashboard
**SLOs** groups objectives by service. The cards at the top filter by **Healthy**, **Warning**, **Breached**, **Degraded** and **Suspended**, and **Needs attention** lists everything that is breached, degraded, warning, failing to compute or not yet computed. Click an SLO to see its compliance, remaining error budget, burn rates and the SLI and data source behind it. **Recompute Now** refreshes it on demand.
## Burn and budget alerts
Open an SLO and use the pencil icon to edit it. **Alert on burn rate**, **Alert on budget warning** and **Alert on tracking failure** control when it alerts, and **Gate deploys on this SLO** controls its deploy gate. Breach alerts arrive like any other alert, so they can page people and trigger runbooks. The thresholds and defaults are in the [SLO reference](/guides/prevent/slo-reference).
## Degraded and no data
An SLO shows **Degraded** when SRE Agent ran the computation and does not trust the answer, for example when the data source is unreachable or returned nothing at all. The reason appears on the card.
An empty answer is treated differently from a zero:
* A service that served no requests counts as 100% compliant. Nothing violated the objective.
* A query that returns no series, rows or datapoints is not reported as 100%. The SLO goes degraded, because a perfect month read off broken monitoring would be misleading.
A degraded SLO recovers by itself: SRE Agent keeps retrying, and the first window with data clears the status and resolves the tracking alert. While it is degraded, it holds the service's deploy gate.
If an SLI shows **Unverified** or no data, open **SLOs > Manage SLIs** and click **Re-probe** once your metrics are flowing. To get good SLIs in the first place, emit one request counter and one latency histogram per service, labelled with the service name, HTTP method, route template and status code.
## Suspend and resume
Click **Suspend** on an SLO (any member can) to pause its computation and alerting, and **Resume** to restart it. The **More** menu on the dashboard has **Maintenance mode (suspend all)** and **Resume all suspended**. Suspending an SLO resolves its own open alerts. A suspended SLO never blocks a deploy, but the gate still reports it so nobody mistakes "not watched" for "healthy".
## Related
* [Connect your data](/guides/get-started/connect-your-data): the data sources an SLI reads.
* [Publish a status page](/guides/prevent/status-page): show SLO health to customers.
* [Triage alerts](/guides/respond/alerts): where SLO breach alerts arrive.
* [Plan matrix](/guides/reference/plan-matrix): which plans include the SLO wizard.
This documentation is built and hosted on [Mintlify](https://mintlify.com), a developer documentation platform.